A data science report is a structured document that transforms technical findings into clear, actionable narratives for stakeholders.
A well-organized report allows non-technical readers to understand the purpose, process, insights, and implications of the analysis without feeling overwhelmed.
Creating a Clear Executive Summary
1. The executive summary provides a concise overview of the problem, key findings, and recommended actions, allowing decision-makers to grasp the essence quickly.
2. It highlights the most important insights without diving into technical detail, making it approachable for executives.
3. The summary should answer “What was analyzed? What was found? What should we do next?”
4. A strong executive summary increases the likelihood that stakeholders engage with the full report.
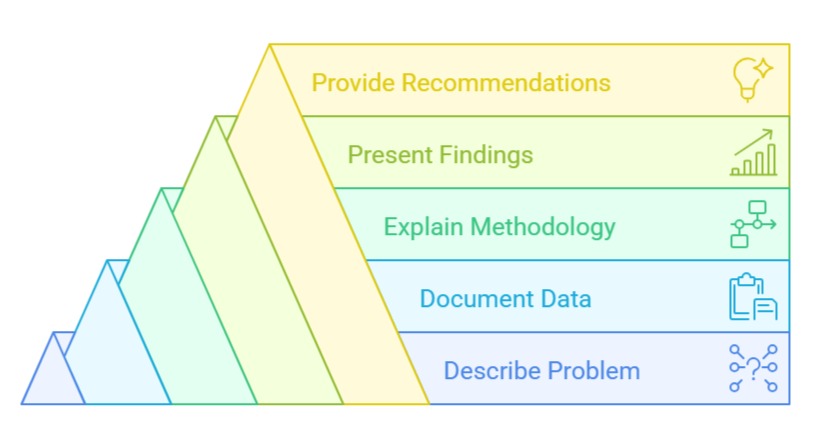
Describing the Problem and Objectives
1. A well-defined problem section sets the context and explains why the analysis is needed.
2. This includes business objectives, analytical goals, and the questions the report aims to answer.
3. Clarity in this section ensures alignment between the analysis and stakeholder expectations.
4. It helps readers judge whether the insights are relevant to the original purpose.
Documenting the Data Used
1. This section describes the sources, types, size, and time range of the data used for analysis.
2. It explains assumptions, limitations, and any preprocessing conducted to prepare the data.
3. Transparency helps readers trust the integrity and relevance of the dataset.
4. Documenting data also ensures the analysis can be reproduced later.
Explaining the Methodology
1. Methodology details the techniques, tools, models, and logic used to derive insights.
2. This includes descriptive analytics, statistical tests, visual exploration, or machine learning techniques.
3. Clear explanations reassure stakeholders that the analysis is rigorous and well-grounded.
4. Methodology enhances credibility, especially for technical readers who want deeper clarity.
Presenting Findings and Insights
1. This section translates analytical results into meaningful interpretations, showing what the data reveals.
2. It should be organized logically—either by themes, metrics, segments, or business questions.
3. Each insight must include supporting evidence such as charts or tables.
4. Strong insight presentation forms the core of the report’s value.
Providing Recommendations
1. Recommendations convert analysis into action steps that support decisions or improvements.
2. They should be specific, practical, and tied directly to findings.
3. This section bridges the gap between data analysis and real-world impact.
4. Good recommendations demonstrate the analyst's understanding of business context.