Traditional monitoring tells you when something has already gone wrong. A threshold is breached, an alarm fires, and the team responds. By the time the alert arrives, users are often already affected.
AI changes this dynamic by recognising patterns in system behaviour, detecting anomalies before they become failures, and predicting incidents before they happen.
AI-Powered Testing
Testing is time-consuming and coverage is never complete. AI improves testing in three meaningful ways.
1. Intelligent test generation: AI analyses your codebase and automatically generates test cases — including edge cases that human testers commonly miss.
Tools like CodeWhisperer and GitHub Copilot generate unit and integration tests from function signatures and code comments. The result is broader test coverage with less manual effort.
2. Visual regression testing: AI-powered tools compare screenshots of your application across deployments and detect visual changes automatically — broken layouts, shifted elements, missing content.
Traditional tests check logic. Visual regression tests check appearance. Tools like Applitools use AI to distinguish meaningful visual changes from acceptable rendering differences.
3. Test prioritisation: In large codebases, running every test on every commit takes too long.
AI analyses code change history and test failure patterns to identify which tests are most likely to fail for a given change — and runs those first. This speeds up CI pipelines without reducing coverage.
Anomaly Detection
An anomaly is a pattern in your system metrics or logs that deviates from normal behaviour, even if it has not yet crossed a threshold that would trigger a traditional alarm. AI detects these deviations automatically.
Amazon CloudWatch Anomaly Detection
CloudWatch Anomaly Detection uses machine learning to establish a baseline of normal behaviour for any metric — response times, error rates, CPU usage, request counts.
It learns the metric's pattern over time — including daily cycles, weekly patterns, and seasonal variations — and creates a dynamic expected range.
When a metric falls outside its expected range, an anomaly is flagged, even if the absolute value has not exceeded a fixed threshold. This means issues are caught earlier and with fewer false alarms than static threshold-based alerting.
Practical example: Your API normally receives 1,000 requests per minute on weekday mornings. On a Tuesday morning it drops to 200. A fixed threshold alarm set at 50 requests per minute would not fire.
CloudWatch Anomaly Detection recognises that 200 is far below the expected range for that time and day and raises an alert immediately.
Amazon DevOps Guru
DevOps Guru is an AWS service purpose-built for operational anomaly detection. It continuously analyses your AWS resources — CloudWatch metrics, CloudTrail events, Config changes — and uses ML to identify operational issues before they cause downtime.
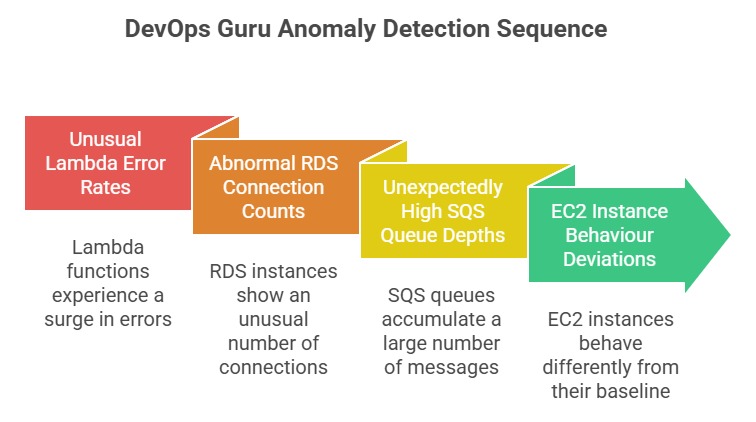
When DevOps Guru identifies an anomaly, it generates an insight — a detailed report explaining what was detected, which resources are affected, and what the likely cause is. It also suggests remediation steps.
DevOps Guru integrates with Systems Manager OpsCenter so insights automatically create operational tickets that the team can act on.
Incident Prediction
Anomaly detection tells you something unusual is happening now. Incident prediction goes further, it tells you something is likely to go wrong soon, based on trends in your system data.
Amazon DevOps Guru for RDS
A specific capability of DevOps Guru analyses database performance metrics and detects early warning signs of database problems — increasing query latency, growing lock contention, rising connection counts — before they escalate into an outage.
It provides specific, actionable recommendations for resolving the issue proactively.
Predictive Scaling
Amazon EC2 Auto Scaling has a predictive scaling mode that uses ML to forecast future traffic based on historical patterns and pre-provisions the right amount of capacity before demand arrives.
Instead of reacting to a traffic spike by scaling up, which takes time — predictive scaling has the capacity ready in advance.
This eliminates the performance degradation window that occurs between a traffic spike arriving and reactive auto-scaling completing.
AI-Powered Log Analysis
Log analysis is one of the most time-consuming parts of incident response. Finding the relevant error in thousands of log lines across multiple services is slow and difficult.
Amazon CloudWatch Logs Insights uses a query language to search and analyse logs quickly.
Combined with anomaly detection, it surfaces unusual log patterns automatically — error messages appearing at higher than normal frequency, new error types that have never appeared before, or a sudden increase in a specific warning.
Amazon Detective analyses AWS CloudTrail logs, VPC Flow Logs, and GuardDuty findings using ML to automatically build a graph of relationships between resources and identify the root cause of security incidents.
Instead of manually correlating events across multiple log sources, Detective visualises the chain of events that led to an incident.