Amazon CloudWatch is the central observability service on AWS. It collects metrics and logs from virtually every AWS service automatically and gives you the tools to visualise, alert on, and analyse that data.
Whether you are monitoring a single Lambda function or an entire production platform, CloudWatch is where that visibility lives.
How CloudWatch Works
CloudWatch sits at the centre of AWS observability. Every AWS service — EC2, Lambda, ECS, RDS, API Gateway, and more — sends metrics and logs to CloudWatch automatically.
No setup required for standard metrics. Custom metrics and logs require your application to send them explicitly.
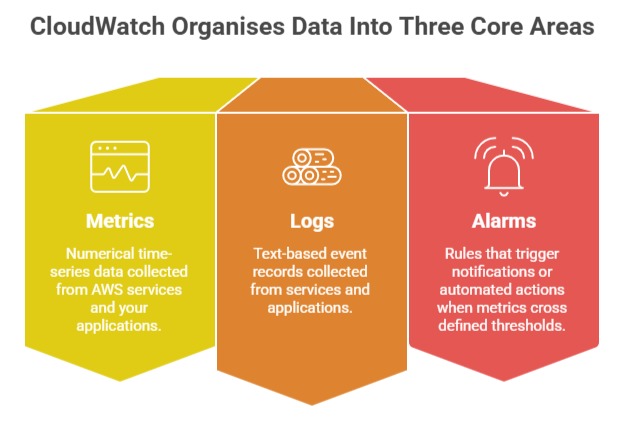
CloudWatch Metrics
A metric is a time-series of numerical values — CPU utilisation measured every minute, request count measured every second, error rate measured every five minutes.
1. Namespaces: Metrics are organised into namespaces — logical groupings by service. For example:
AWS/EC2 — EC2 instance metrics.
AWS/Lambda — Lambda function metrics.
AWS/RDS — Database metrics.
AWS/ApiGateway — API Gateway metrics.
Custom metrics your application sends live in a namespace you define. For example, MyApp/Orders for business-level metrics like orders per minute.
2. Dimensions: Dimensions are key-value pairs that identify a specific resource within a namespace. For example, the EC2 namespace uses InstanceId as a dimension — so you can view CPU utilisation for a specific instance rather than all instances combined.
3. Standard vs. Detailed Monitoring: By default, most AWS services send metrics every 5 minutes — this is standard monitoring. Enabling detailed monitoring reduces this to 1 minute intervals. Detailed monitoring costs extra but gives you faster visibility into issues as they develop.
4. Custom Metrics: Your application can send custom metrics to CloudWatch — business metrics, application-level counters, performance measurements that AWS cannot collect automatically. Custom metrics are priced per metric per month, so be deliberate about what you track.
CloudWatch Dashboards
A dashboard is a visual display of metrics — graphs, numbers, and charts assembled into a single view. Dashboards give your team a real-time picture of system health without needing to navigate to each service individually.
What to Put on a Dashboard
A well-designed production dashboard shows the metrics that matter most for your system. A typical dashboard for a web application includes:
1. Request count and error rate is traffic normal and is the error rate acceptable?
2. API latency are response times within acceptable bounds?
3. EC2 or ECS CPU and memory are resources under pressure?
4. Lambda invocations, errors, and duration are functions executing correctly?
5. Database connection count and query latency is the database healthy?
Dashboard Best Practices
Organise dashboards by audience and purpose. A high-level executive dashboard shows availability and business metrics.
An engineering on-call dashboard shows detailed technical metrics grouped by service. Keep each dashboard focused — too many metrics on one screen makes it harder to spot issues, not easier.
Dashboards can be shared with your team through a public URL or within your AWS organisation.
For teams using third-party tools like Grafana, CloudWatch is a supported data source — you can build dashboards in Grafana pulling data directly from CloudWatch.
CloudWatch Alarms
An alarm watches a single metric and performs an action when the metric crosses a threshold you define. Alarms are the primary way CloudWatch notifies your team when something needs attention.
Alarm States
Every alarm is always in one of three states:
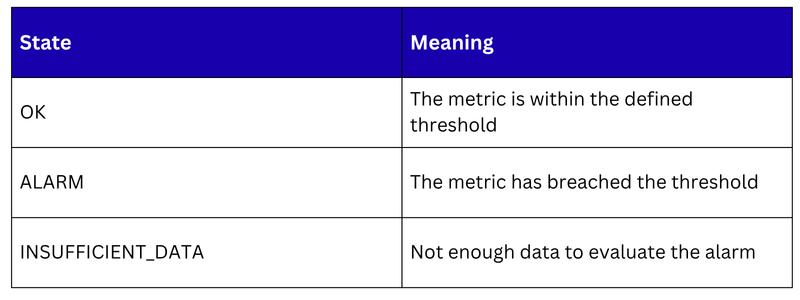
Alarm Actions
When an alarm transitions to the ALARM state, it can trigger one or more actions:
1. SNS notification: Send an email, SMS, or trigger a webhook to notify your team.
2. Auto Scaling action: Add or remove EC2 instances in response to load.
3. EC2 action: Stop, terminate, reboot, or recover an EC2 instance.
4. Lambda function: Trigger a Lambda function for custom automated remediation.
5. Systems Manager action: Run an automation document to resolve the issue.
Composite Alarms
A composite alarm combines multiple alarms using AND and OR logic.
Instead of being paged for every individual alarm, you define a composite alarm that only fires when a combination of conditions is true. For example, alert only when both error rate is high AND latency is elevated. This reduces alert noise significantly.
Anomaly Detection Alarms
Rather than setting a fixed threshold, you can create an alarm based on CloudWatch Anomaly Detection. The alarm fires when the metric deviates from its learned baseline rather than when it crosses a static number.
CloudWatch Log Groups
A log group is a container for log streams that share the same retention policy and access controls. Every application or service that sends logs to CloudWatch gets its own log group.
Log Streams
Within a log group, individual log streams represent a single source — a specific Lambda function invocation, a specific EC2 instance, a specific container. Log streams are created automatically.
Retention Policies
By default, CloudWatch logs are kept indefinitely — which gets expensive. Always set a retention policy on every log group. Common retention periods:
1. Development environments — 7 to 14 days.
2. Production application logs — 30 to 90 days.
3. Security and compliance logs — 1 to 7 years depending on requirements.
CloudWatch Logs Insights
Logs Insights is a query engine for your log data. Instead of scrolling through raw log lines, you write queries to filter, aggregate, and analyse logs quickly. It is essential for debugging production issues at scale.
A simple query to find errors in the last hour:
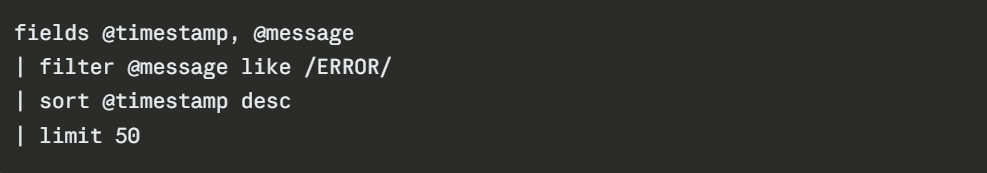
This returns the 50 most recent error messages sorted by time — what would take minutes of manual scrolling takes seconds with Logs Insights.

Class Sessions
Sales Campaign

We have a sales campaign on our promoted courses and products. You can purchase 1 products at a discounted price up to 15% discount.