Deploying an application is not the finish line, it is the starting line for a new set of responsibilities.
Once code is running in production, you need to know how it is behaving, why it is behaving that way, and where problems are occurring when they do.
This is what observability provides. It is the practice of understanding the internal state of your system from the outside, using the data your system produces.
Monitoring vs. Observability
These two terms are often used interchangeably but they mean different things.
Monitoring tells you that something is wrong. A CPU alarm fires. An error rate threshold is breached. You know there is a problem.
Observability tells you why something is wrong. By looking at the right combination of metrics, logs, and traces, you can understand what is happening inside the system without needing to guess or reproduce the issue manually.
Monitoring answers — is the system healthy?
Observability answers — why is the system behaving this way?
A well-observed system lets you answer questions you did not think to ask when you set up your monitoring.
The Three Pillars
Pillar 1 — Metrics
Metrics are numerical measurements of system behaviour collected over time. They are the most efficient data type for understanding system health at a glance and setting up alerts.
What metrics measure:
1. CPU and memory utilisation on EC2 instances.
2. Request count and error rate on an API.
3. Lambda invocation count, duration, and throttles.
4. Database connection count, query latency, and read/write throughput.
5. SQS queue depth and message age.
Metrics are cheap to store and fast to query. They tell you what is happening and when it started — but not why.
On AWS: Amazon CloudWatch collects metrics from virtually every AWS service automatically. No configuration needed for standard metrics.
Pillar 2 — Logs
Logs are time-stamped records of discrete events that happened inside your system. Every request processed, every error thrown, every decision made — logs capture the narrative of what your application actually did.
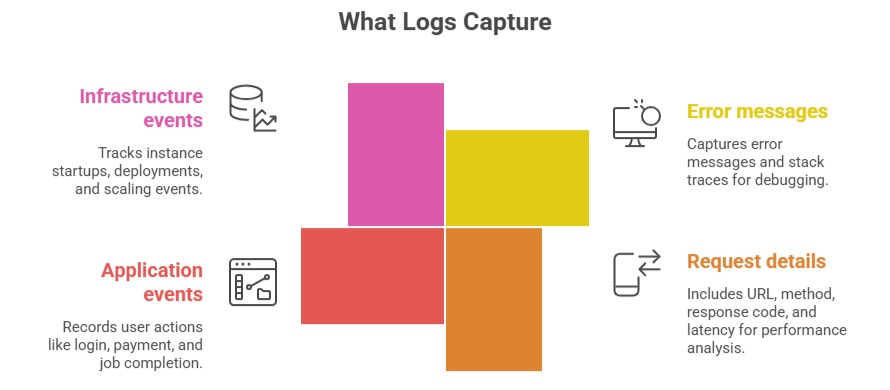
Logs answer what happened in detail. They are essential for debugging — metrics tell you something went wrong, logs tell you exactly what the error was.
Logs have a cost: Storing and querying large volumes of logs is expensive. Be deliberate about what you log — log enough to diagnose problems, but avoid logging every trivial event.
On AWS: Amazon CloudWatch Logs collects logs from EC2, Lambda, ECS, API Gateway, and most AWS services.
Pillar 3 — Traces
Traces track a single request as it flows through multiple services.
In a microservices architecture, a single user request might touch an API Gateway, trigger a Lambda function, query a database, call another service, and write to S3 — all in sequence. A trace follows that entire journey end to end.
What traces reveal:
1. Which service in the chain is slow.
2. Where an error originated — was it the database, the Lambda function, or the downstream API?
3. The total end-to-end latency of a request and the contribution of each service.
Without traces, debugging latency issues and errors in distributed systems requires correlating logs from multiple services manually — a slow, error-prone process. Traces do this correlation automatically.
On AWS: AWS X-Ray provides distributed tracing. It instruments your Lambda functions, API Gateway, ECS services, and other AWS resources to capture trace data automatically.
How the Three Pillars Work Together
Each pillar answers a different question. In practice, you move between them when diagnosing an issue:
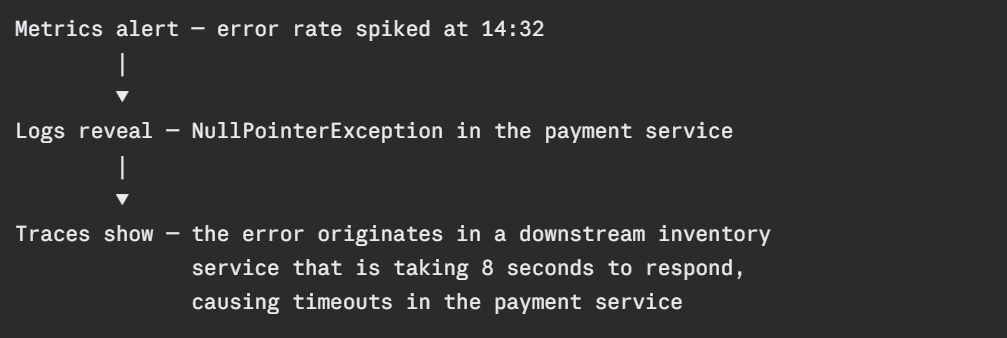
Metrics surface the problem. Logs provide the detail. Traces show the cause. All three together give you the full picture.
Key Observability Concepts
1. Cardinality: The number of unique values a label or tag can have. High-cardinality data — like user IDs or request IDs — is powerful for debugging individual issues but expensive to store as metrics. Keep metric labels low-cardinality.
2. Retention: How long you keep observability data. Metrics are typically retained for weeks or months. Logs for days to months depending on compliance requirements. Traces for days. Balance visibility needs against storage costs.
3. Instrumentation: The act of adding observability to your application. Some instrumentation is automatic — CloudWatch collects EC2 and Lambda metrics without any code changes. Custom instrumentation requires adding logging statements, metric emissions, and trace annotations to your application code.
4. Structured logging: Logs written as JSON rather than plain text are far easier to query and filter. Instead of searching through free-text logs, structured logs let you filter by specific fields — error code, user ID, request duration.