CloudWatch tells you a problem exists. Logs give you detail about individual events.
But in a distributed system, where a single user request touches multiple Lambda functions, APIs, databases, and services, neither metrics nor logs alone can show you the full journey of that request.
AWS X-Ray fills this gap by tracing requests end to end across every service they touch, giving you a visual map of exactly where time is being spent and where errors are occurring.
What is AWS X-Ray?
X-Ray is a distributed tracing service that tracks requests as they flow through your application.
It collects timing data from each service the request passes through, assembles it into a complete trace, and presents it visually in the AWS Console as a service map and a timeline.
Instead of correlating timestamps across separate CloudWatch log groups to understand what happened during a slow or failed request, X-Ray does that correlation automatically and shows you the result in a single view.
Core Concepts
Trace
A trace is the complete record of a single request from start to finish, across every service it touched. Every trace has a unique trace ID that is passed along with the request as it moves between services.
This is what allows X-Ray to stitch together data from multiple services into one coherent picture.
Segment
A segment is the data recorded by a single service for its portion of the request.
Every service that participates in tracing produces a segment — Lambda, API Gateway, EC2, ECS, and supported AWS SDKs all generate segments automatically when X-Ray is enabled.
Subsegment
A subsegment is a more granular unit within a segment. It captures specific operations within a service, a database query, an outbound HTTP call, an S3 read.
Subsegments let you pinpoint exactly which operation inside a service is causing slowness or errors.
Service Map
The service map is a visual diagram generated automatically by X-Ray that shows all the services in your application and how requests flow between them.
Each node shows the request rate, error rate, and average latency for that service. This is the fastest way to identify which service in a chain is the source of a problem.
Annotations and Metadata
Annotations are key-value pairs you add to traces to make them searchable — user ID, order ID, feature flag state. You can then filter traces by annotation to find all requests related to a specific user or transaction.
Metadata is additional context attached to a trace that is not indexed for searching, useful for storing richer debugging information without incurring the cost of indexing.
How X-Ray Works in Practice
When X-Ray is enabled, each service in your architecture adds timing and error data to the trace as the request passes through it. Here is how a traced request through a serverless API looks:
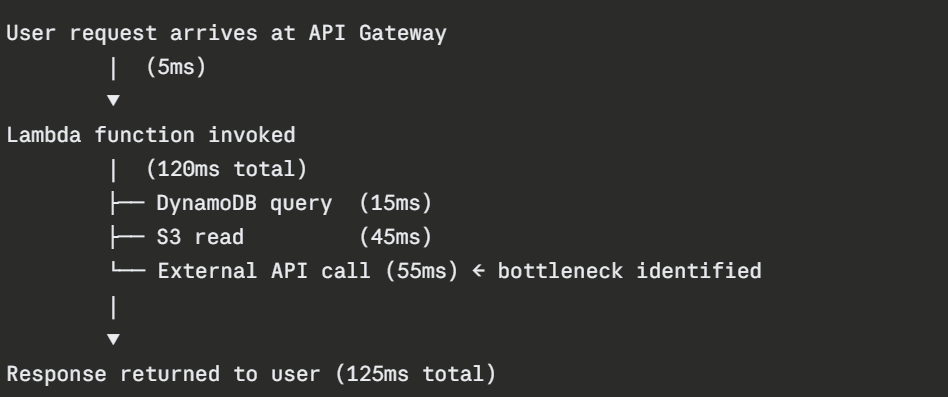
X-Ray shows you this timeline visually. You can see immediately that the external API call is consuming 55ms of the total 125ms response time, nearly half. Without X-Ray, identifying this would require manually correlating Lambda logs with timing data.
Enabling X-Ray
X-Ray tracing is enabled differently depending on the service:
1. AWS Lambda: Enable active tracing in the Lambda function configuration. One toggle in the console or one line in your IaC definition. No code changes needed for basic tracing.
2. API Gateway: Enable X-Ray tracing on a per-stage basis in the API Gateway settings. Again, no code changes required.
3. Application code: For custom subsegments, tracing a specific database call or outbound HTTP request — you add the X-Ray SDK to your application and instrument the specific operations you want to trace.
This requires a small amount of code but gives you much finer visibility.
4. ECS and EC2: The X-Ray daemon must run alongside your application. For ECS, add the X-Ray daemon as a sidecar container in your task definition. For EC2, install the daemon as a background process.
X-Ray Sampling
Tracing every single request in a high-traffic system would be expensive and unnecessary. X-Ray uses sampling to record a representative subset of requests rather than all of them.
The default sampling rule records the first request each second and 5% of additional requests.
You can customise sampling rules, for example, always trace requests that result in errors, sample 1% of successful requests, and sample 10% of requests to a specific endpoint.
Sampling lets you get full observability value at a fraction of the cost of tracing everything.
X-Ray Groups and Insights
Groups let you filter traces by expression for example, create a group for all traces with a response time above 2 seconds, or all traces that contain errors.
Groups make it easy to focus on the requests that matter most for performance and reliability investigations.
X-Ray Insights automatically detects anomalies in your trace data, a sudden increase in fault rates, a service that starts responding more slowly than its baseline. Insights notify you of these changes so you can investigate before they escalate.
X-Ray with CloudWatch ServiceLens
AWS integrates X-Ray with CloudWatch through ServiceLens, a unified view that combines the X-Ray service map, CloudWatch metrics, and CloudWatch logs in a single interface.
Instead of switching between X-Ray for traces and CloudWatch for metrics and logs, ServiceLens presents all three together.
When you click on a service in the ServiceLens map, you see its metrics, recent log entries, and traces side by side. This is the fastest way to diagnose production issues — all the context in one place.