CloudWatch Logs works well for individual services. But as your infrastructure grows — multiple applications, multiple environments, dozens of Lambda functions, ECS services, EC2 instances, logs become scattered across many separate log groups.
Finding the root cause of an issue that spans multiple services means jumping between log groups and manually correlating events.
Amazon OpenSearch Service solves this by giving you a single place where all logs are aggregated, indexed, and searchable in real time across your entire infrastructure.
What is Amazon OpenSearch Service?
Amazon OpenSearch Service is a managed search and analytics engine built on OpenSearch , the open-source fork of Elasticsearch.
It ingests large volumes of log data, indexes it automatically, and lets you search and analyse it using full-text queries, filters, and aggregations.
For DevOps teams, OpenSearch is primarily used as the core of a centralised logging platform, a single destination where logs from every service flow into and where engineers go to search, analyse, and visualise log data.
The Centralised Logging Architecture
The most common pattern for centralised logging on AWS uses three components working together:
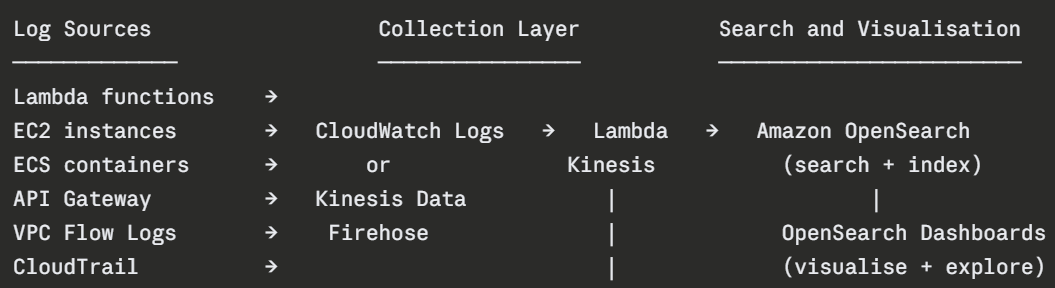
Logs from all sources flow into a collection layer, either CloudWatch Logs or Kinesis Data Firehose, which delivers them to OpenSearch in near real time. OpenSearch indexes every log entry and makes it instantly searchable.
Getting Logs Into OpenSearch
From CloudWatch Logs
CloudWatch Logs can be configured to stream log data directly to OpenSearch using a subscription filter.
You define a filter on a CloudWatch log group and CloudWatch automatically forwards matching log entries to an OpenSearch domain via a Lambda function.
This is the simplest approach, if your logs already go to CloudWatch, adding a subscription filter to forward them to OpenSearch requires minimal configuration.
From Kinesis Data Firehose
For higher-volume log streams — VPC Flow Logs, CloudTrail events, application logs at scale — Kinesis Data Firehose is the better collection layer.
Firehose buffers log data and delivers it to OpenSearch in batches, providing better throughput and built-in error handling. If delivery fails, Firehose automatically backs up failed records to S3.
Firehose also supports data transformation, you can run a Lambda function on each batch to parse, enrich, or filter log data before it reaches OpenSearch.
OpenSearch Dashboards
OpenSearch Dashboards, previously called Kibana is the built-in visualisation tool that comes with OpenSearch Service. It provides a browser-based interface for searching logs, building visualisations, and creating operational dashboards.
Key Capabilities:
1. Discover: The primary log search interface. You write queries, apply time filters, and browse individual log entries. Full-text search across all indexed fields means you can find any log entry in seconds regardless of which service produced it.
2. Visualisations: Build charts, graphs, and tables from your log data — error rate over time, top error messages by frequency, request volume by service, geographic distribution of traffic.
3. Dashboards: Combine multiple visualisations into a single operational view. A centralised logging dashboard might show error rates across all services, the top 10 most frequent error messages, and a time-series view of log volume — all in one screen.
4. Alerts: OpenSearch Dashboards supports alerting — define a condition based on a log query and receive a notification when that condition is met. For example, alert when more than 100 error log entries appear within a 5-minute window.
Structuring Logs for OpenSearch
OpenSearch is significantly more powerful when logs are structured. Structured logs, written as JSON are parsed and indexed field by field, making every field individually searchable and filterable.
A structured log entry from a Lambda function:
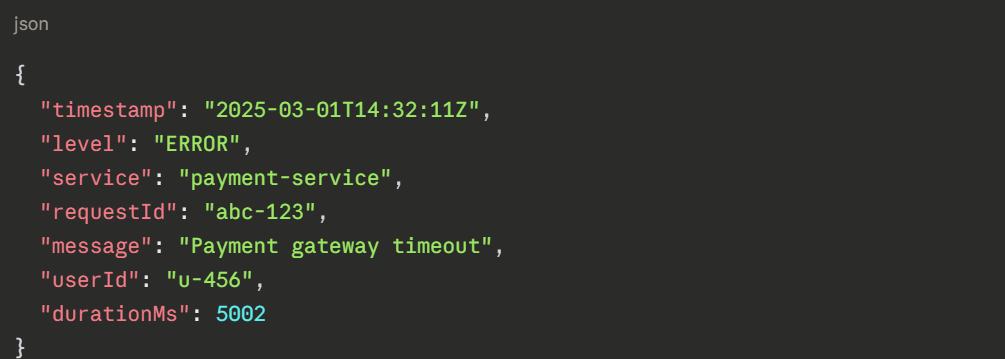 With this structure, you can search for all errors from the payment service, filter by a specific user, or find all requests that took longer than 5 seconds — instantly, across millions of log entries.
Plain text logs require more complex parsing and produce significantly less useful search results.
Index Management
Every log entry stored in OpenSearch occupies storage. As log volume grows, managing indices becomes important for both cost and performance.
1. Index State Management (ISM): ISM lets you define automated policies for your indices. For example, move indices older than 7 days from hot storage to warm storage, and delete indices older than 30 days automatically. This keeps storage costs controlled without manual cleanup.
2. Index templates: Define the mapping and settings for new indices automatically so every new log index has the correct field types and storage configuration from the moment it is created.
Security Considerations
-Picsart-CropImage (1).png)