Collecting metrics, logs, and traces is only valuable if someone or something acts on them.
An alert that fires but goes unnoticed, an incident that requires ten manual steps to respond to, or an on-call engineer who receives hundreds of notifications and cannot identify which ones matter.
These are signs that observability data is not being turned into effective action.
What Makes a Good Alert
Before building alerts, it is worth defining what a good alert looks like. A good alert has three properties:
1. Actionable: When the alert fires, there is a clear action the recipient should take. An alert that says "CPU is high" with no context and no defined response is not actionable. An alert that says "API error rate exceeded 5% for 3 consecutive minutes — check CloudWatch Logs for payment-service errors" is.
2. Accurate: The alert fires when there is a real problem and does not fire when there is not. An alert that fires frequently without a real problem is called a false positive, and it is the fastest way to train your team to ignore alerts entirely.
3. Timely: The alert fires early enough for the team to respond before significant user impact occurs. An alert that fires 30 minutes after a problem started is better than nothing but not good enough for a production system.
CloudWatch Alarms as the Foundation
CloudWatch Alarms are the primary alerting mechanism on AWS. The key to effective alerting is configuring them correctly.
1. Use multiple evaluation periods: Rather than alarming on a single data point, which can be a spike require the metric to breach the threshold for several consecutive evaluation periods. For example, error rate above 5% for 3 out of 3 evaluation periods of 1 minute each. This eliminates transient spikes from triggering false alarms.
2. Alert on symptoms, not causes: Alert on what users experience — high error rates, slow response times, unavailability — rather than on internal system metrics like CPU usage. CPU at 90% may or may not be a problem. An error rate of 10% definitely is.
3. Use composite alarms: Composite alarms combine multiple alarms with AND/OR logic. Alert only when error rate is high AND latency is elevated — not just when one condition is true alone. This dramatically reduces noise.
Routing Alerts — Amazon SNS
When a CloudWatch Alarm fires, it sends a notification to an Amazon SNS topic. SNS then distributes that notification to one or more subscribers — email addresses, SMS numbers, HTTP endpoints, Lambda functions, or SQS queues.
Alert Routing Best Practices
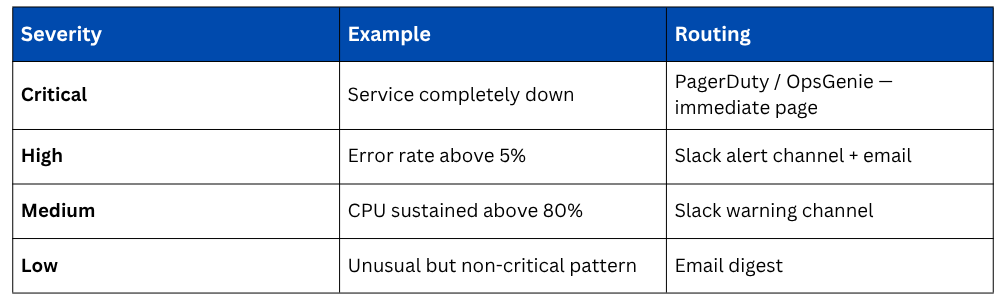
Route alerts by severity. A critical production outage should wake someone up immediately. A warning about elevated memory usage during off-hours can wait until morning.
Incident Response Workflows
When an alert fires and requires human response, a defined incident response workflow ensures the right things happen in the right order, quickly and consistently, regardless of who is on call.
AWS Systems Manager Incident Manager
AWS Systems Manager Incident Manager is a purpose-built incident response service. When an alert fires, Incident Manager can automatically:
1. Create an incident record with the alert details, affected resources, and severity.
2. Page the on-call engineer through PagerDuty, OpsGenie, or SMS.
3. Start a video bridge for team coordination.
4. Attach a runbook — step-by-step response instructions — directly to the incident.
5. Track all actions taken during the incident for the post-mortem.
This means the moment an alarm fires, the entire incident response process kicks off automatically, without someone needing to manually create a ticket, find the runbook, and notify the team.
Runbooks
A runbook is a documented procedure for responding to a specific type of incident. Every common incident type should have a runbook:
1. API error rate spike — check these CloudWatch logs, look for these patterns, escalate if X.
2. Database connection exhaustion — run this query, check these metrics, apply this fix.
3. Deployment failure — roll back using this procedure, notify these people.
Runbooks reduce the cognitive load on the on-call engineer, especially at 3am, and ensure the response is consistent regardless of experience level.
AWS Systems Manager Automation can make runbooks executable, rather than a document of manual steps, an automation runbook runs the steps programmatically.
A Lambda function is invoked, an EC2 instance is restarted, a scaling policy is adjusted — all triggered automatically from the incident record.
Automated Remediation
The most mature incident response involves no human at all for well-understood failure modes. Automated remediation uses Lambda functions triggered by CloudWatch Alarms to respond to incidents automatically.

The pattern is always the same, CloudWatch Alarm fires → SNS topic receives notification → Lambda function is invoked → remediation action is taken automatically.
Post-Incident Reviews
Every significant incident, and many minor ones — should be followed by a post-mortem or post-incident review. DevOps culture treats these as blameless learning exercises.
A post-mortem answers:
1. What happened and when?
2. What was the user impact?
3. What caused the incident?
4. How was it detected — alert, user report, or accidental discovery?
5. What actions were taken and did they help or hurt?
6. What can be done to prevent recurrence?
7. What can be done to detect it faster next time?
The output of a post-mortem should be concrete action items — new alerts, runbook improvements, infrastructure changes, or code fixes with owners and deadlines.